
Procurement brief for Singapore teams: queue detection analytics benchmarked up to 93% accuracy, PDPA controls, and 2–6 week pilot plans.
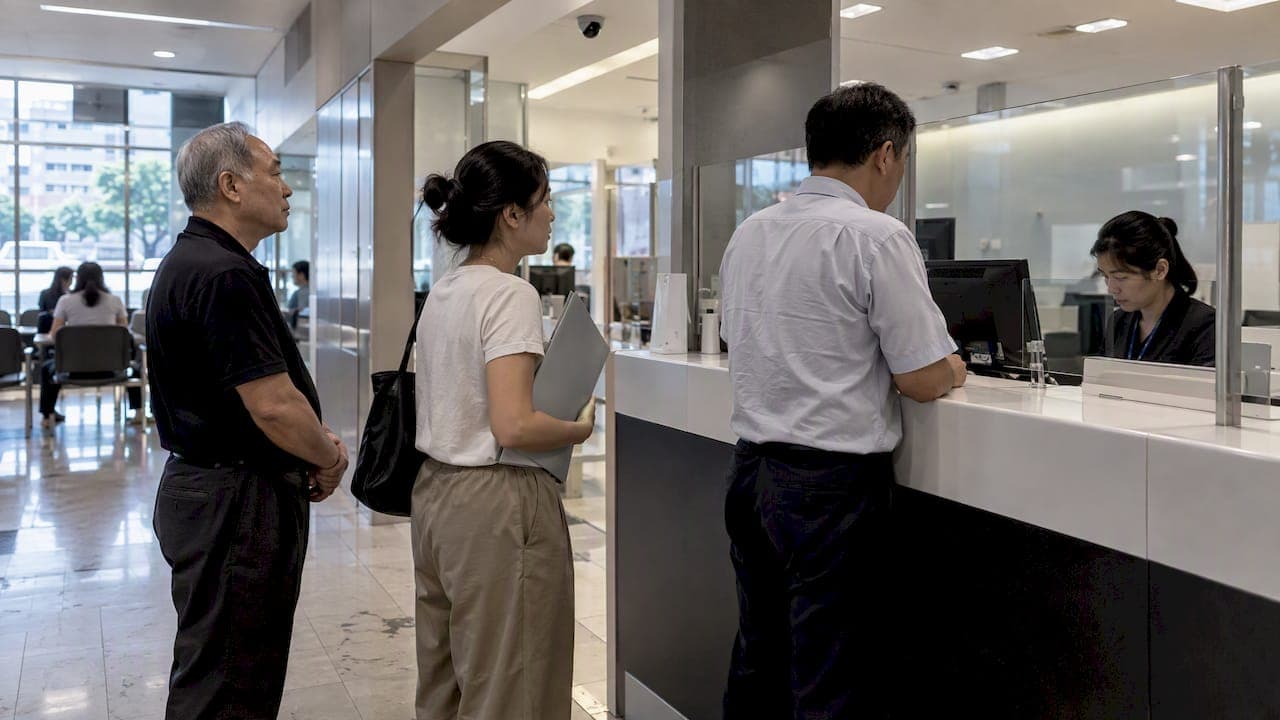
93% Accuracy for Queue Detection Analytics for Singapore Procurement

Queue detection analytics delivers real-time queue length, wait-time estimates, and abandonment alerts by combining AI video analytics with edge inference, turning raw camera feeds into operational signals. The approach draws on PDPC guidance and peer-reviewed vision research. Most organizations validate it through a pilot before scaling to production.
TL;DR:
- Queue detection models achieve up to 93% accuracy in controlled environments, but real-world factors like occlusion and low resolution can reduce effectiveness.
- Deployment architectures—edge, hybrid, or cloud—impact latency, privacy, and costs, with edge-first preferred for real-time alerts and sensitive data.
- Valid pilots should include site-specific datasets, clear latency and accuracy targets, and explicit testing of edge versus cloud inference.
- Systems rely on detection, tracking, and short-term prediction models, with fine-tuning necessary for high-density or occluded queue lines.
- Privacy measures like on-device anonymization and strict data retention policies are essential for PDPA compliance, especially when dealing with identifiable video feeds.
Table of Contents
- What queue detection analytics measures and why it matters
- Core technical approaches: detection, tracking, and wait-time prediction
- Key metrics and dashboards: what to measure and why it changes decisions
- Accuracy, testing, and expected performance: evidence from research and pilots
- Deployment patterns: edge-first, hybrid, and cloud approaches
- Privacy, compliance, and PDPC guidance for analytics using video
- Industry use cases and decision criteria by vertical
- How we approach queue detection analytics in applied pilots
- When a pilot makes sense versus buying off the shelf
- How we can help you run a queue analytics pilot
- FAQ
- Sources
What queue detection analytics measures and why it matters
Queue detection analytics covers a measurement hierarchy that procurement teams often collapse into one bucket, which causes mismatched expectations. Occupancy counting tells you how many people or vehicles sit in a defined zone at a given moment. Queue length extends that into a spatial measure along a line. Wait time estimates how long an individual spends between entry and service, and abandonment rate flags people who leave before being served. Flow-stage transitions track movement between zones, such as from a waiting area to a checkout counter, which is where bottlenecks usually hide.
Data sources vary by use case:
- CCTV or IP cameras work well for most indoor and semi-outdoor queues and reuse existing infrastructure.
- Dedicated depth or thermal sensors suit low-light or privacy-sensitive zones where facial detail is unwanted.
- Hybrid camera-and-sensor setups cover large or irregular spaces where a single viewpoint cannot capture the full queue.
The operational goal is rarely counting for its own sake. Teams use these measurements to reduce abandonment, right-size staffing against real demand, and automate routing decisions that used to rely on a supervisor's guess.
Core technical approaches: detection, tracking, and wait-time prediction
Most queue analytics systems are built on three layers: detection, tracking, and prediction, and the choices made at each layer determine accuracy and cost.
- Detection. YOLO-family detectors dominate this space because they balance speed and accuracy well enough for live video. Fine-tuning a general-purpose model to a single class, people or vehicles, consistently improves precision over a stock multi-class model, since the network stops splitting capacity across irrelevant object types.
- Tracking. A detector alone only tells you what is in a frame; tracking algorithms similar to Deep SORT assign persistent identities across frames, which is what makes flow metrics and transition counts possible rather than just a snapshot occupancy number
- Prediction. Rule-based approaches map observed queue length to an expected wait time using historical averages, which is simple but brittle under unusual demand. Machine learning approaches, particularly LSTM or other recurrent architectures, improve short-term prediction accuracy by folding in time-series patterns and external inputs like time of day or service-counter staffing, as recent queue length prediction research demonstrates.
Latency expectations separate systems quickly. A dashboard refreshed every few minutes is fine for workforce planning, but a system meant to trigger real-time signage or staff alerts needs inference in the tens of milliseconds, which pushes the decision toward edge compute rather than a round trip to a cloud endpoint.
Pro Tip: Ask any vendor for their model's class-specific precision and recall, not just an overall accuracy figure, since a model tuned for general object detection often underperforms on dense, occluded queue lines.
Key metrics and dashboards: what to measure and why it changes decisions
A queue analytics dashboard earns its budget line only when its metrics map directly to an action someone takes. The core KPI set worth tracking:
- Current queue length, the live count of people or vehicles waiting.
- Average wait time, calculated from entry to service timestamps.
- Abandonment rate, the share of entries that leave before service.
- Saturation or occupancy, how full a zone is relative to its safe or efficient capacity.
- Throughput, the rate of completed services per unit time.
Fine-tuned detection models have reached queue estimation accuracy of up to 93% in peer-reviewed testing, which is the kind of precision that makes automated threshold alerts trustworthy rather than noisy.
Threshold-based alerts are where these metrics become operational: a saturation alert can page a floor supervisor, trigger a digital signage message redirecting traffic, or fire a CRM event that opens an additional service channel. Historical dashboards, aggregated over weeks, feed staffing schedules and inform layout changes, such as widening a bottleneck point that daily snapshots would never reveal.
Accuracy, testing, and expected performance: evidence from research and pilots
Peer-reviewed work gives procurement teams a real benchmark instead of vendor marketing. Fine-tuned YOLO models evaluated for vehicle queue length estimation reached accuracy up to approximately 93%, with inference times reported around 7.55 milliseconds in tested configurations, according to MDPI research on video-based queue estimation. Those numbers hold under the conditions the researchers controlled for: calibrated cameras, consistent object size assumptions, and a single detection class.
Camera-based queue analytics are often chosen over costly roadside or token-based systems because cameras are flexible, carry low incremental cost, and retrofit onto existing CCTV infrastructure.
Real deployments diverge from lab conditions in predictable ways. Common failure modes include occlusion from crowd density, poor camera angles that compress perspective, and low-resolution feeds that blur small or distant objects. Transfer learning, retraining a pretrained model on site-specific footage, measurably improves detection of small or stacked objects in these conditions.
Before signing a pilot agreement, decision-makers should require:
- A labeled dataset of a defined minimum size, drawn from the actual deployment site rather than stock footage.
- A documented latency service-level agreement covering end-to-end detection-to-alert time.
- Minimum precision and recall targets stated per object class, not as a blended average.
- Explicit test runs comparing edge and cloud inference under real traffic conditions.
Deployment patterns: edge-first, hybrid, and cloud approaches
Architecture choice shapes latency, privacy exposure, and long-term cost more than any single algorithm decision.
- Edge-first deployments process video on-site, which keeps raw footage off external networks and typically achieves the lowest latency, a pattern favored where privacy risk or real-time alerting matters most.
- Hybrid setups run detection and tracking locally while sending only aggregated metrics to a cloud business-intelligence layer, balancing responsiveness with centralized reporting across multiple sites.
- Cloud-only architectures centralize everything, which simplifies model updates and cross-site analytics but introduces bandwidth costs and latency that rules out real-time signage triggers.
An integration checklist worth running before any architecture decision: confirm camera compatibility with ONVIF or RTSP standards, estimate bandwidth needs against existing network capacity, and size GPU or accelerator requirements against expected camera count. Ongoing operational tasks matter just as much as the initial build: scheduled model updates as footage patterns shift, remote debugging access for field issues, and periodic camera recalibration as physical layouts change. Teams managing compute at scale for video workloads often reference broader data center infrastructure planning when sizing edge or hybrid deployments across multiple sites.
Privacy, compliance, and PDPC guidance for analytics using video
Any queue analytics deployment that touches video of identifiable individuals falls under data protection obligations, and PDPC advisory guidance sets out a clear preference: anonymize where feasible, and lean on the business improvement or research exceptions only where the specific conditions apply. Revised guidance from 2024 sharpens those exceptions further, with explicit expectations around retention limits and documented data protection impact assessments.
Practical controls worth building into any deployment:
- On-device blurring or anonymization so raw identifiable footage never leaves the camera.
- Role-based access controls limiting who can view raw feeds versus aggregated metrics.
- Secure retention schedules with automated deletion once the retention window closes.
- A documented DPIA covering the specific use case, not a generic template.
Pro Tip: Request a vendor's data retention and deletion workflow in writing before a pilot starts. It reveals more about their compliance maturity than any marketing claim about "privacy-first" design.
A procurement checklist should also confirm how a vendor handles audit requests and whether their anonymization approach has been tested against re-identification risk, not just described in a brochure. Our own guidance on data privacy in sensing deployments and on privacy by design principles covers the kind of RFP language that makes these commitments enforceable.

Industry use cases and decision criteria by vertical
The same underlying technology serves very different operational goals depending on the vertical.
- Retail uses queue analytics at checkout lines and fitting rooms to automate staffing decisions and trigger additional register openings before abandonment spikes.
- Transport and terminals apply vehicle queue detection to optimize throughput at toll points, drop-off zones, and parking facilities, a use case well documented in traffic queue estimation research.
- Healthcare and public services track appointment adherence and support priority routing for urgent cases without requiring a staff member to manually monitor every waiting room.
- Corporate facilities manage cafeteria peak loads and visitor flow, coordinating operations in ways that overlap with broader facility management use cases.
The common thread across verticals is that queue length alone rarely tells the full story. Flow-stage tracking, which measures transitions between waiting and service stages, is usually what reveals where a bottleneck actually starts.
How we approach queue detection analytics in applied pilots
We build queue detection analytics around a field-proven pilot model rather than a one-size-fits-all deployment. A two-week proof-of-concept format for tailgating and access scenarios extends naturally to queue monitoring, and edge-first pilots typically run two to six weeks with multi-sensor tracking achieving latency under 10 milliseconds. Deliverables include a camera survey of the actual site, an anonymized pilot dataset, a defined evaluation metrics report, and a rollout plan for production scaling. Our edge-first video analytics pilot approach and multi-sensor tracking checklist outline the engineering practices behind these latency targets.

Procurement teams evaluating any vendor, including us, should ask for class-specific accuracy figures, a documented latency SLA, and a clear data retention and deletion workflow before committing to a pilot.
When a pilot makes sense versus buying off the shelf
A pilot earns its cost when camera placement is uncertain, occlusion risk is high, or the site mixes use cases that a generic model has not seen before. Success criteria should be numeric: a minimum precision and recall target per class, a latency ceiling, and a defined pilot dataset size. When a site is simple, well-lit, and single-purpose, a managed platform with proven defaults often gets you to production faster than a custom pilot. Either way, start by writing your acceptance criteria before you talk to a vendor.
— Eumir
How we can help you run a queue analytics pilot
We bring queue detection analytics to life through Solution Integration services built around edge-first deployment, from camera survey through production rollout, and our Ecosystem Matchmaking connects you with the right integration partners when a project spans multiple vendors.
If you are weighing a pilot against a full rollout, we can walk through acceptance criteria, latency targets, and compliance controls specific to your site. Request a technical walkthrough to get started.
FAQ
How long does a queue detection analytics pilot typically take?
Edge-first pilots commonly run two to six weeks, covering camera survey, model fine-tuning, and evaluation against defined accuracy and latency targets. A shorter two-week format is realistic for narrower proof-of-concept scopes with a single camera and use case.
What camera setup do I need for queue detection analytics?
Most deployments work with existing IP or CCTV cameras using ONVIF or RTSP protocols, provided placement gives a clear, calibrated view of the queue line. Dedicated depth or thermal sensors are an option for low-light or privacy-sensitive zones where facial detail should be minimized.
How accurate is AI-based queue length detection?
Peer-reviewed testing of fine-tuned YOLO models reports queue estimation accuracy up to approximately 93%, with inference times around 7.55 milliseconds in controlled setups, according to MDPI research. Real-world accuracy depends heavily on camera calibration, lighting, and occlusion, which is why pilot testing on-site matters.
Is video-based queue analytics compliant with Singapore's PDPA?
Compliance depends on implementation, but PDPC advisory guidance recommends anonymization where feasible and outlines business improvement and research exceptions with safeguards like retention limits and documented DPIAs. Vendors should be able to show their anonymization method and retention schedule in writing.
Should I choose edge, cloud, or hybrid processing for queue analytics?
Edge-first processing suits real-time alerting and privacy-sensitive sites since footage stays on-premises and latency stays low. Hybrid setups work well when you need centralized reporting across multiple locations while keeping detection local, and cloud-only architectures fit centralized analytics where real-time signage triggers are not required.
Sources
- Efficient Video-based Vehicle Queue Length Estimation using Computer Vision and Deep Learning for an Urban Traffic Scenario
- Advisory Guidelines on the PDPA for Selected Topics (PDPC)
- Real-Time Vehicle Queue Length Prediction Using YOLOv11 and Machine - Learning Techniques
Recommended
Read More Articles
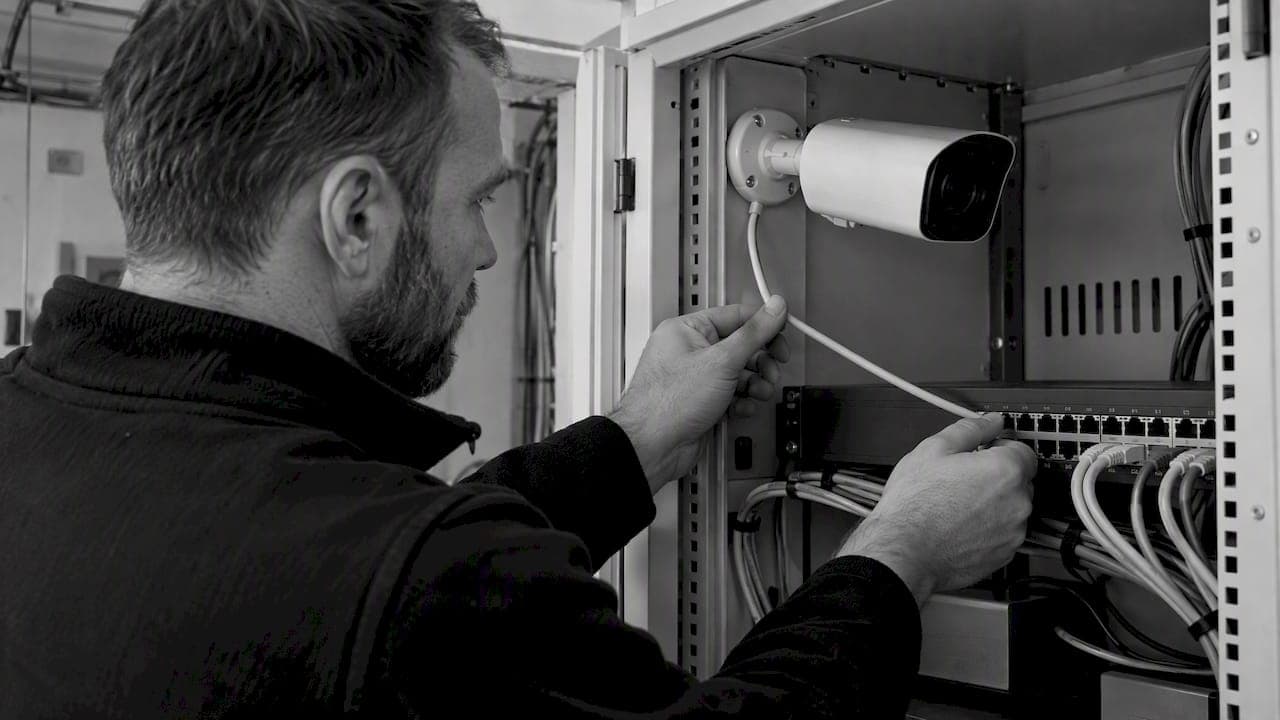
RTSP Security Risks: Integrators Must Block Exposed Ports 554 and 8554
See how integrators can reduce RTSP security risks: close exposed ports 554 and 8554, secure camera access, and verify each deployment with practical checks.
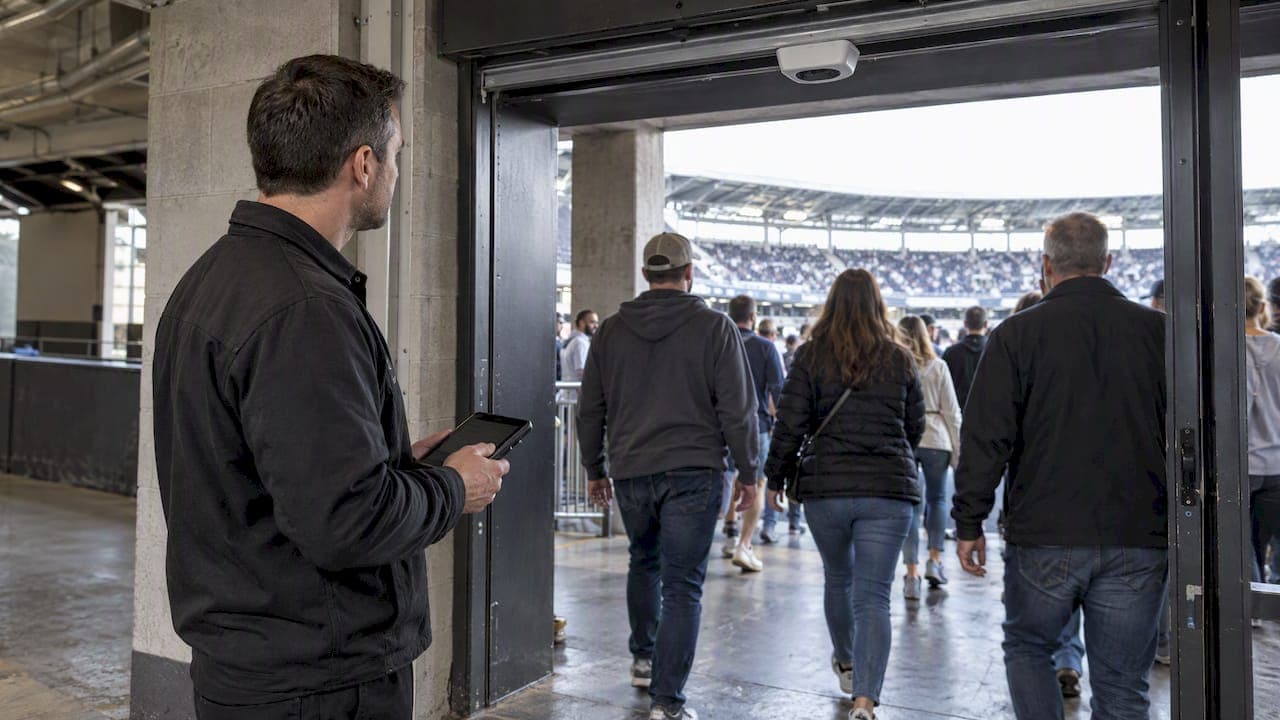
Require MAEpp and X Accuracy Before You Buy People Counting Systems
Verify people counting accuracy by demanding MAEpp, X Accuracy, and directional-bias reports. Validate on-site with at least 100 events per direction...
30–90 Day Pilot Validates Redundant Camera Networks for Engineers
Standards led, practical steps for engineers to deploy redundant camera networks: MRP, dual homing, and aggregation patterns, commissioning checks, and...
30 Day Pilot Proves Video Analytics Accuracy for Security Teams
Validate video analytics accuracy with scenario tests, camera tuning, transfer learning and a 30 day edge first pilot for security teams.
Let's Build YourSecurity Ecosystem.
Whether you're a System Integrator, Solution Provider, or an End-User looking for trusted advisory, our team is ready to help you navigate the BeyondSensor landscape.
Direct Advisory
Connect with our regional experts for tailored solutioning.